Advanced ColourSpace Operation
ColourSpace uses no fixed structure step-by-step walk-through's for any form of calibration, instead providing a selection of powerful tools that can be applied as required.
With this approach a user with knowledge and understanding of the requirements for calibration and colour management can apply the various tools in different ways to generate the best possible end result, to a far better level than systems that use fixed step-by-step walk-throughs.
User Guides
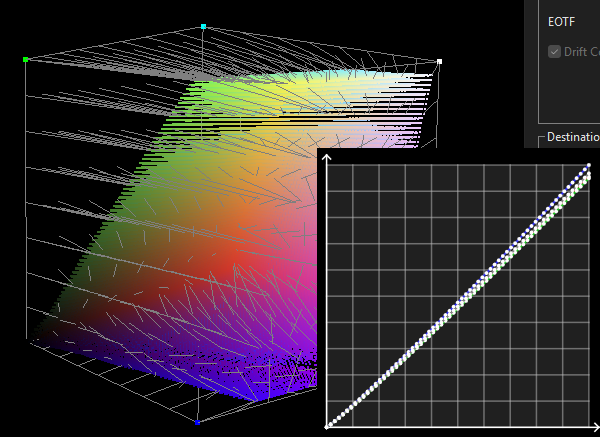
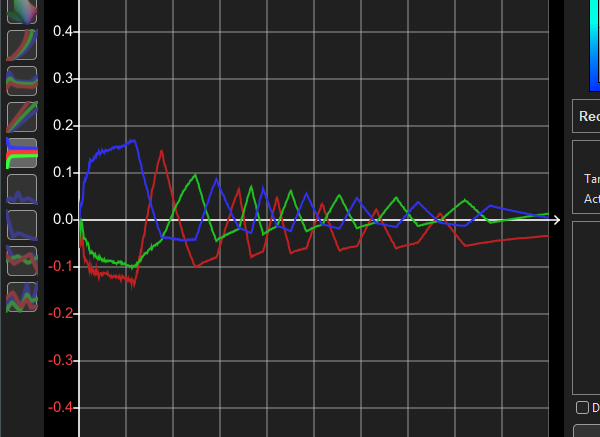
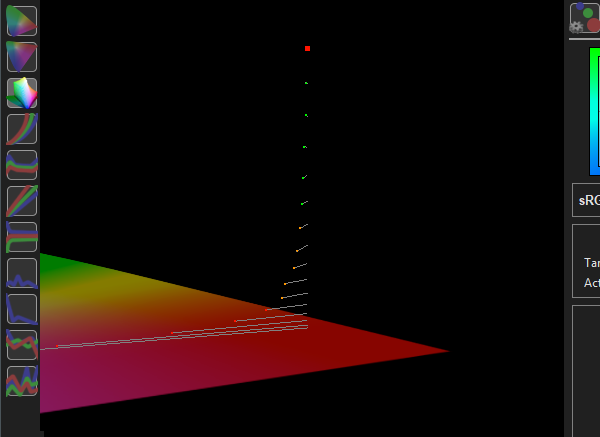
ColourSpace Graphs
Understanding what ColourSpace graphs show
ColourSpace Graphs
colourspace graphs, calibration graphs, display analysis, colour accuracy graphs, gamut visualisation, calibration data interpretation, colour management tools
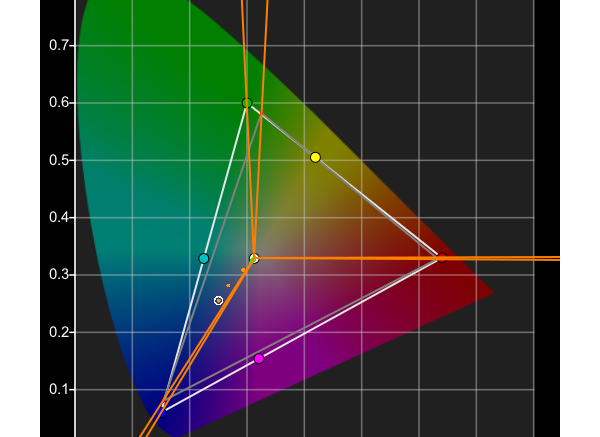
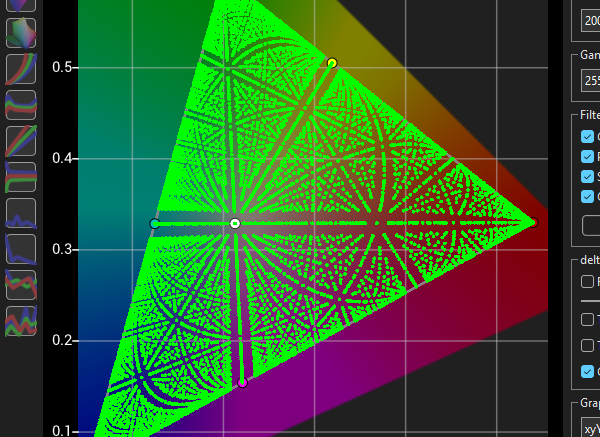
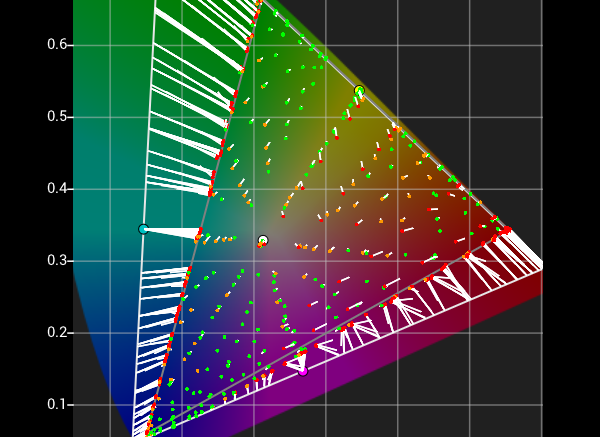
Calibration Gamut Coverage
Understanding Calibration Gamut Coverage
Calibration Gamut Coverage
gamut coverage calibration, colour gamut analysis, display gamut measurement, calibration accuracy, colourspace gamut tools, hdr gamut evaluation
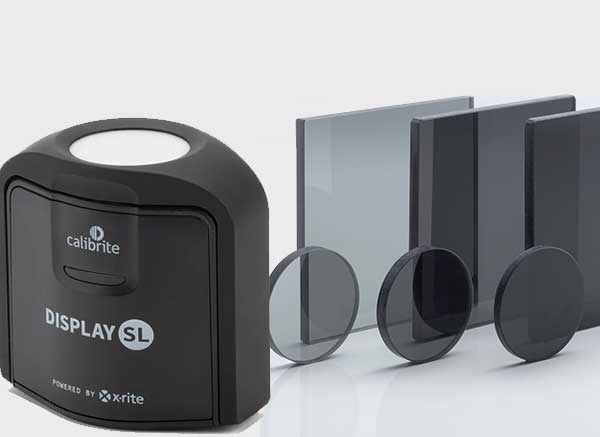
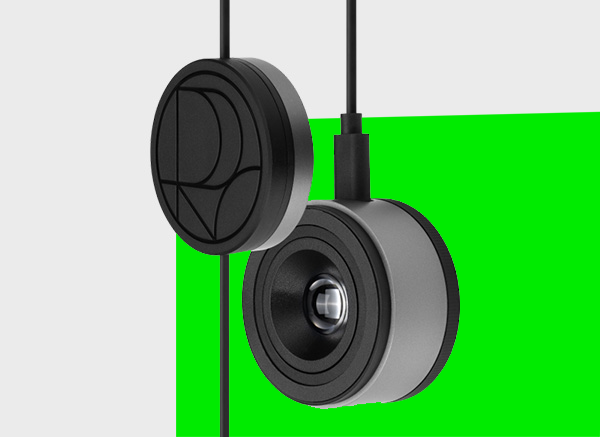
Extend Probe Range
Extend the Dynamic Range of any probe
Extend Probe Range
probe dynamic range extension, nd filters calibration, low light measurement, high luminance profiling, probe optimisation colourspace
Focused Patch Sets
Focused Patch Sets for ultimate calibration
Focused Patch Sets
focused patch sets, calibration optimisation, custom patch sequences, display profiling accuracy, colourspace patch control
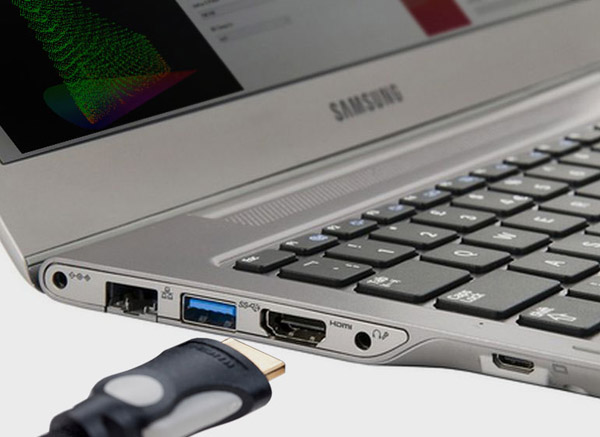
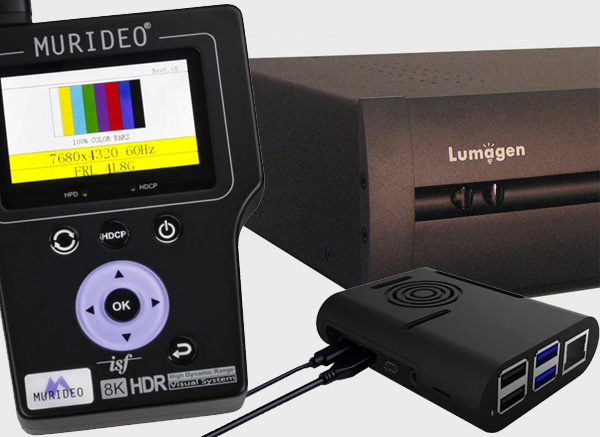
Direct HDMI
Direct HDMI Profiling
Direct HDMI
hdmi profiling, direct signal measurement, test pattern generation, tpg workflow, display profiling hdmi input

Look LUTs Design
Generating creative Look LUTs
Look LUTs Design
look luts design, creative lut generation, colour grading luts, display look management, colourspace lut tools
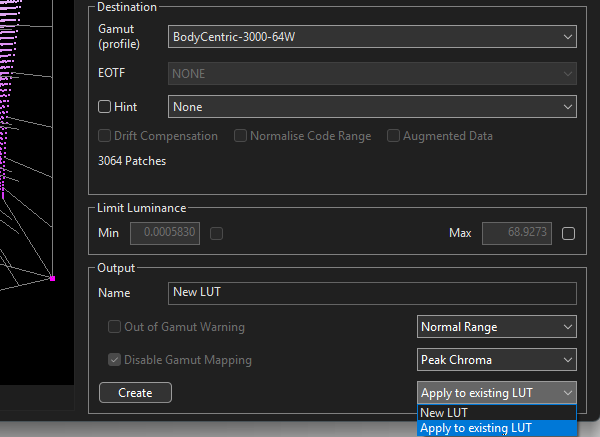
LUT Concatenation
Concatenate LUTs to enhance end results
LUT Concatenation
lut concatenation, combine luts, calibration refinement, colourspace lut workflow, advanced lut processing
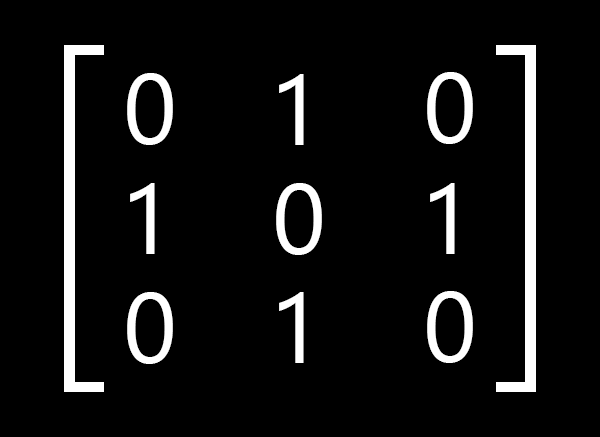
Matrix Calibration
Matrix Profiling & calibration
Matrix Calibration
matrix calibration, display profiling matrix, colour correction matrix, probe matching, colourspace calibration tools
Patch Sets via Profiles
Using profiles to define patch sets
Patch Sets via Profiles
profile based patch sets, custom patch generation, calibration profiling workflow, colourspace advanced patches
Perceptual Colour Matching
Overcoming display Metameric Failure
Perceptual Colour Matching
perceptual colour matching, metameric failure correction, visual display matching, human vision calibration, display consistency
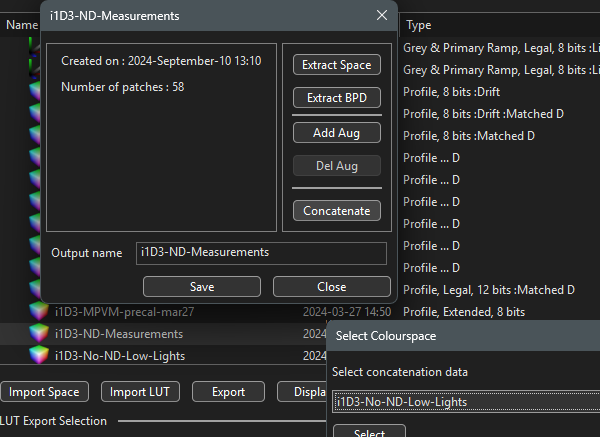
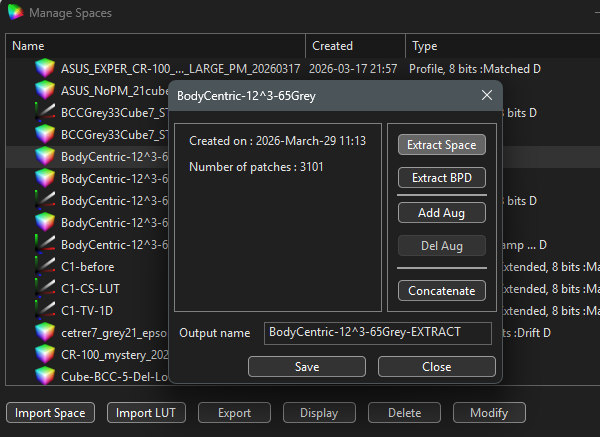
Profile Concatenation
Concatenate multiple Profiles
Profile Concatenation
profile concatenation, combine calibration profiles, advanced profiling workflow, colourspace profile tools
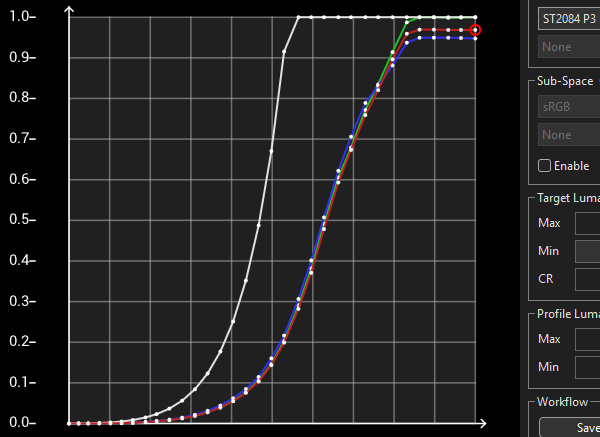
PQ based HDR
Understanding PQ based HDR calibration
PQ based HDR
pq hdr calibration, hdr workflow, perceptual quantiser, hdr display setup, colourspace hdr tools
Reduced Gamut Profiling
Calibrating difficult displays
Reduced Gamut Profiling
reduced gamut profiling, difficult display calibration, limited gamut correction, colourspace advanced workflows
Re-Measure Patches
Re-measure any patch or group of patches
Re-Measure Patches
patch remeasurement, calibration refinement, lut correction workflow, colourspace remeasure tools

ReShade
ReShade LUT Generation
ReShade
reshade lut generation, game calibration, shader lut workflow, colourspace reshade integration
Self Verification
Verifying a display to itself
Self Verification
accuracy verification, calibration refinement, lut correction workflow, colourspace verification tools
Separate LUT Components
Separating & Swapping LUT components between LUTs
Separate LUT Components
separating lut components, 1d and 3d luts, lut component swapping, lut editing, calibration refinement tools, colourspace lut manipulation
TPG Operation
ColourSpace & TPG Operation
TPG Operation
tpg operation, test pattern generator control, calibration signal generation, colourspace tpg workflow
TV Calibration Patch Sets
Manual TV Calibration user patch sets
TV Calibration Patch Sets
tv calibration patch sets, manual calibration workflow, display tuning patches, colourspace tv calibration

Virtual Sets
On-set Virtual Production
Virtual Sets
virtual production calibration, led wall calibration, on set colour management, virtual sets workflow
(W)OLED Gamut Correction
Correction (W)OLED near black gamut
(W)OLED Gamut Correction
woled gamut correction, oled near black calibration, display artefact correction, colourspace oled tools
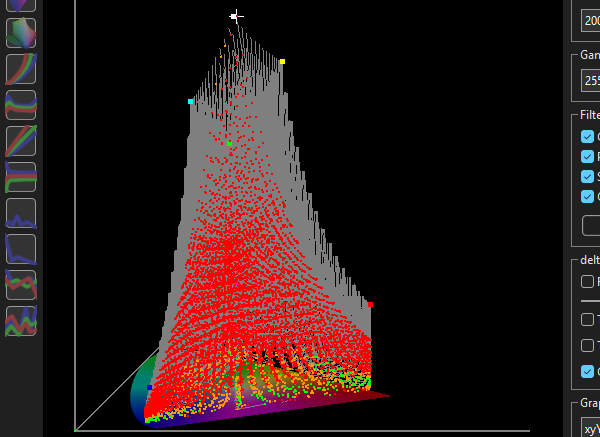
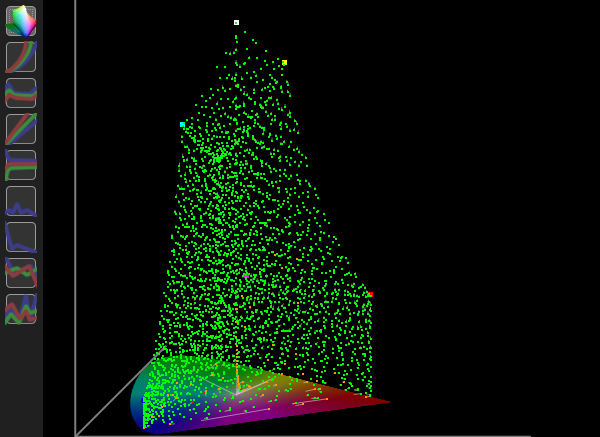
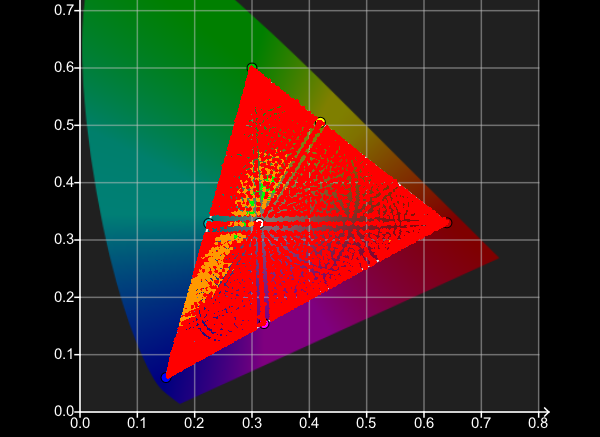
Volumetric Gamut Coverage
Reporting accurate Gamut Coverage
Volumetric Gamut Coverage
volumetric gamut coverage, 3d gamut measurement, display colour volume, calibration reporting accuracy