For very obvious reasons, when considering calibration accuracy there is a big focus on Delta-E values, with low dE values for grey scale and primary colours being seen as a good sign of accuracy. Many calibration system suppliers specifically go out of their way to provide all sorts of reporting capabilities to prove their calibration is accurate using Delta-E values for grey scale and RGB primary colours.
But, is this correct?
The reality of relying on Delta-E
The simple answer is no, it is not at all correct, and often has little real relevance to the overall accuracy of calibration.
A very easy explanation can be as simple as the fact that real-world images do not contain grey scales, or even much in the way of grey or pure red, green or blue as actual colours. It is only technically generated images that have such perfect colours, which shows there is an underlying issue with the way many systems approach calibration & verification, as it is these unnatural colours that are the focus of most calibration systems.
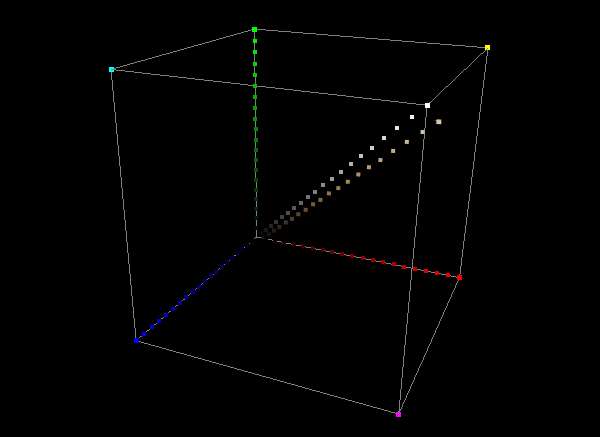
The image here shows the standard Delta-E values reported as an example of calibration accuracy, based on Grey Scale, and RGB Primary ramps. All the black space is unverified for accurate calibration, and can easily be wildly inaccurate.

Because of the limited number of points that such Delta-E verification focuses on it is very possible for the actual underlying calibration to be widely inaccurate when real-world images are viewed, even though the Delta-E values report accurate calibration.
A far better and very obvious way to verify calibration is to perform a second profile post-calibration, using a full volumetric patch set and assess the 3D graphs within ColourSpace, including assessing the dE values for all volumetric verification measurements.
Colour accuracy
Delta-E (dE) is a single number that represents a difference between two colours, with the basis that a dE of 2.3 is the Just Noticeable Difference (JND), or smallest colour difference the human eye can see.
So, theoretically any dE less than 2.3 is imperceptible, while any dE greater than 2.3 is noticeable. However, some colour differences greater than 2.3 can be imperceptible, while some colour differences below 2.3 can be very visible, depending on the colour being measured.
Additionally, and more importantly, when Delta-E is used to represent calibration accuracy it is normal to only report a limited number of colour points. Usually the grey Scale and RGB primary colours only are represented, as shown above, or a small selection of colours based on something like the Macbeth Colour Checker. Neither is good enough in reality, as far too few points are being used to try to verify the total volumetric colour space.
Note: Although a dE of 2.3 is regarded as the technical JND value, many refer to a value of 1.0 as being a more realistic threshold for imperceptible difference.
Problems with Delta-E
To gain a mental image of the problems being outlined here think of skin tones. The average Caucasian skin tone resides well away from any grey scale, or primary colours, and as such is ignored by most calibration systems when performing a post-calibration verification. More importantly colours such as skin tones, grass, sky, etc, are memory colours, which means the human eye has a good idea as to what they should look like as they are seen almost daily. And equally importantly there are many different variations of hues, saturation and brightness associated with each memory colour or tone. Without accurate display verification that includes these variations the calibration results can never be considered as accurate.

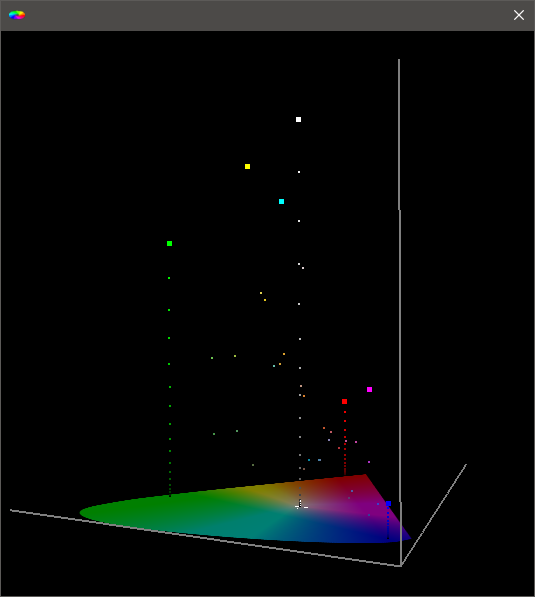
The cube image above shows a standard grey scale and primary RGB verification, with skin tone added to show its approximate location for reference. All the black space (including the skin tone patches) are effectively un-verified in most calibration systems.
It should be understood that if displays were perfectly linear in colour reproduction - any change in input signal would produced an exactly equal change in the displayed colour - it would be possible to perform a grey scale and primary colour calibration only, and extrapolate/interpolate the calibration of the remaining colours. Unfortunately very few displays are in anyway linear. More annoyingly, those displays that are close to linear are the highly expensive professional monitors which are routinely calibrated with professional 3D LUT profiling systems, whether the display needs it or not. It is lower-cost displays, such as home TVs that are almost always of poor linearity, and therefore can only be accurately calibrated, and verified, via professional level full 3D cube based profiling and calibration.
This requirement for accurate calibration of displays with poor linearity (which is most displays as stated above) requires the use of 3D LUTs generated from full 3D cube based profiles.
But, not all 3D LUT based calibration is made equal - because of the overriding desire of many calibration systems to focus, incorrectly, on Delta-E, grey scale and primary colours as the definition for accurate calibration.
This is not to say that Delta-E reports are useless, and should be ignored, or that the values they report are untrustworthy (ignoring the fact that the actual values reported can be deceptive), but that good Delta-E values alone are no guarantee of accurate calibration. All the colours that Delta-E values do not report on are equally important, and must be equally as accurate for good final calibration.
Every Colour Point MUST Be Considered Equal
From the above description of calibration issues it can be seen that every colour point has to be given equal importance during profiling and calibration and verification, not just grey scale and primary colours.
That above statement is so important for accurate calibration it is worth stating again!
Every volumetric colour point has to be given equal importance during profiling and calibration, not just grey scale and primary colours!
And the only way to do that is to verify multiple volumetric points, using as many points as possible for any critical calibration verification, so that the entire colour space is covered, with a good level of granularity.
The following graphically illustrates this point.
The first verification graph shows a normal Grey & Primary Ramp, plus Memory Colours verification, and as can be seen there is a huge amount of unverified volumetric space.
The second graphs uses a 1000 patch volumetric verification, and the thirst graph a 3000 patch verification. The different is obvious, and obviously the volumetric verifications far better defines the final calibration accuracy.
Delta-E & the Human Visual System (HSV)
All Delta-E values are an attempt to provide a value that in some way defines the way the HVS (Human Visual System) will respond to colour variations under different display conditions and contrast levels.
For example, where a given colour value sits relative to the peak brightness of the target colour space defines the likely sensitivity of the HVS to see variations in colour, and so the same technical colour variation will generate a different Delta-E value depending on its relative brightness vs. the peak luma value.
In simple terms, the darker the colour, the greater the technical colour variation can be be before the reported Delta-E value becomes large, compared to the same colour when brighter, where for the same technical colour variation the reported Delta-E value will be significantly larger.
This can be seen by looking at the dE00 values reported for a given xy colour error of x -0.0065, y 0.0062, with only the Y value changing and identical for both target and measured, using a peak target luma of 100 nits, on a Rec709 display.
- Near Black - dE00: 0.0002
- Grey - dE00: 5.0661
- Near Peak White - dE00: 8.0879
As can be seen, the closer the measured value brightness is to the target peak white, the greater the dE value, as the HVS can perceive colour errors more easily when the image is brighter.
The actual luminance values used for the above example is not really relevant - it just the understanding that the same value colour error produces a greater dE value as brightness increases that matters.
PQ HDR, Delta-E, & ITP
The advent of PQ based HDR has brought another twist into the concept of Delta-E as an assessment of display colour accuracy.
PQ HDR is an absolute standard, and uses a 10,000 nits as the target peak luma. However, no display can actually manage 10,000 nits peak... Therefore, how can a Delta-E value accurately represent a given display's colour accuracy, relative to the perception of the HVS, if the peak luma of the given display is substantially lower than 10,000 nits, especially as many home TVs are sub-1,000 nits?
Unfortunately, a new dE metric - dE ITP - has been introduced for use with PQ HDR, which is locked to 10,000 nits as the reference target brightness when applied to a ST2084 (PQ) profile. This means the reported dE value for a given measured brightness point will not change with PQ displays that have different peak brightness capabilities, which is not in keeping with the HVS's response to different contrast level viewing conditions.
If the PQ standard of 10,000 nits is used to define Delta-E values for a display that has a far lower peak luma, the reported values will be inaccurate relative to the perception of the HVS, and show a greater level of accuracy than the HVS actually perceives.
However, as defined above, all other Delta-E calculations (other than dE ITP) use a defined target peak luma as the reference for dE value calculations, so using the display's actual peak luma value as the target will generate a more perceptually accurate dE00/76 value compared to using the PQ HDR default of 10,000 nits with dE ITP (or with dE00/76).
This is exactly how ColourSpace works, enabling any target peak luma value to be defined for any colour space, including PQ based HDR, which means a valid and perceptually accurate dE value is generated for PQ based HDR when using dE 2000 or dE 1976 on any display, as the effect of different target peak luma values on the HVS can be correctly taken into consideration.
This improved perceptual value is due to the target peak luma being the true peak of the display, and therefore meaning all measurements are closer to the peak value, so generating more realistic dE values.
Using 10,000 nits as the target peak value would mean all actual measurements would be far below the 10,000 nits target peak, and so would generate distorted, and widely optimistic, lower than reality dE00/76 values, as shown with the above previous example where the dE00/76 values are considerably lower the further away they are from the target peak white.
dE 2000 & dE 1976 vs. dE ITP
The dE calculations of dE00/76 are dependent on the L*a*b values of the measured and reference patches, which are calculated with reference to the absolute luminance of the reference white. This is not the case in ITP.
The values calculated for dE00/76 will therefore be different if the absolute luminance of the white reference changes. dE00/76 are relative measures of colour difference. The closer to the luminance of reference white your sample is, the more likely you will see a colour difference, hence a greater dE value.
This can be demonstrated in ColourSpace when reviewing a PQ profile, by changing the target colour space peak white value, and swapping between dE00/76 and ITP. dE ITP values will be unaffected by any change in luminance of PQ reference white, while dE00/76 will show changes.
It is obviously possible to use dE ITP with SDR and HLG display profiles within ColourSpace, but the dE algorithms used by ITP will report substantially varied values compared to dE00/76, and will erroneously suggest visual errors in the calibration that are not actually there/visible.


